How much trade cost will the ongoing US-China trade war generate for global value chains?
Jie Wu and Jacob Wood
Apr, 2024
#Trade and FDI
#East Asia and Pacific
#North America
The United States (US) and China represent the two largest economies in the World. Since China first entered the World Trade Organization (WTO) in 2001, its bilateral trade with US has grown exponentially, reaching 660 billion US dollars (USD) by the end of 2018 (United States Census Bureau, 2022). Despite the significance of this trade relationship, the nature of the trade activity was much lopsided, with the US incurring a large and ever-increasing trade deficit with China. By 2016, this deficit had reached 347 billion USD (USCB, 2022) and was a major political issue of the 2016 US presidential campaign. During the latter, Donald Trump led a strong campaign which sought to rectify this deficit, claiming that China was taking advantage of unfair trading practices, such a lack of market access for US businesses and intellectual property theft (SCMP, 2020). Once in office, former US President Trump engaged in an aggressive new trade policy regime, which sought to increase tariff levels in sectors that were of strategic importance to China, such as cars, hard disks, and aircraft parts (SCMP, 2020). Since the China-specific tariffs were first implemented by the US on July 06, 2018, the US and China have been embroiled in an escalating series of four additional tit-for-tat tariff rounds. Against this background, this blog post tackles the question: How much trade cost does the still ongoing US-China trade war generate?
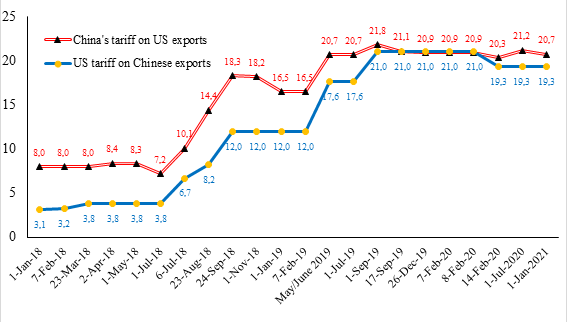
Over the past years, the tariff rate increase of the US on China has been particularly significant, with the trade-weighted average tariff rate rising nearly seven times in two years, as shown in Figure 1. After many protracted negotiations, a deal was finally reached and signed at the White House on January 15, 2020. This US-China trade deal represented the first phase of mutual tariffs suspension.
According to the 2018 import data for products subject to tariffs imposed by China and US, one can obtain the proportion of total imports that face an additional tariff levy under the Broad Economic Classification criteria. The results show that “intermediate products” account for the most significant proportion, with the number of products for China and the US reaching 65% and 38%, respectively. The coverage will have a substantial and complex impact not only on both countries’ bilateral trade relationship, but also on their trade with other countries worldwide (Mao & Görg, 2020).
Figure 1. US and China tariff rate changes since January 2018
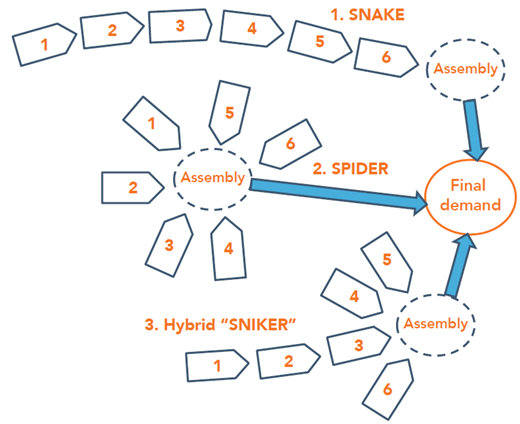
Within the global production network, trade barriers placed on intermediate goods have a cumulative effect, leading to significant increases in total trade costs (Muradov, 2017; Rouzet & Miroudot, 2013). Yi (2003, 2010), Ma and Van Assche (2010), and Ferrantino (2012) highlighted that the accumulation of trade costs along the supply chain is non-linear. Ferrantino (2012) showed that when trade costs are proportional to the value of goods, the rise in total trade costs is exponential. Yi (2010) analyzed the factors associated with the increase in trade costs and provided two justifications: First, trade costs accumulate due to the multiple cross-border transactions that occur in cases of vertical specialization. Second, tariffs are commonly levied on a good’s total (gross) import value instead of the value added in the most recent production stage. Baldwin and Venables (2010) analyzed the relationship between trade costs and the organization of GVCs using two extreme forms of the latter: “spiders” and “snakes”. The accumulated costs in “spider” value chains are likely to be lower, as the first-tier suppliers of parts and components are arranged around a central assembly plant, which ships the end product to its final destination. This means that inputs cross the border only twice: first as a part, then as a final output. In the case of “snake” GVCs, trade barriers accumulate along the sequential stages of production and are passed down the international industrial chain, significantly increasing trade costs. In real life, actual supply chains are rather “snikers”- hybrids of spiders and snakes (Figure 2). At the Initiative on Global Markets (IGM) Forum at the Chicago Booth School of Business in July 2018[3], 43 leading economists argued that the cost of import tariffs would be higher today than 25 years ago because of the deepening of global value chains (GVCs). Against this backdrop, it is interesting to examine how much trade cost the ongoing US-China trade war generates in the context of global value chains.
Figure 2. The global value chain zoo: spiders, snakes, and “snikers”
What are the cumulative tariff costs along GVCs?
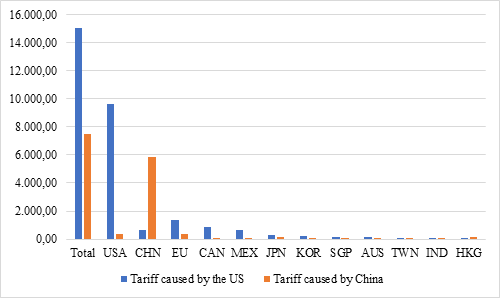
Based on the theory of GVC accounting, Muradov (2017) proposed a framework for calculating the cumulative effect of tariffs across GVC, by assuming that the tariffs implemented on intermediate goods were completely passed on to downstream producers. However, during the actual production process, as a result of policy subsidies and the allocation of specific production costs, the mark-up associated with the upstream tariff costs is not completely passed on to the downstream manufacturers. Using the OECD Inter-Country Input–Output Model, our research (Wu et al., 2021) proposes an improved incomplete tariff pass-through measurement of cumulative tariff costs incurred across GVCs; that is, we assume that the pass-through of the indirect tariff cost is inverse to the length of the production chain. Such an approach provides a more accurate picture of the impact of the US-China trade war not only on themselves but also on third-party countries. We found that five rounds of tit-for-tat tariff escalation have resulted in an indirect tariff burden of around 23 billion USD in total, of which 67% was caused by the tariffs imposed by the US on Chinese imports. Moreover, perhaps unsurprisingly, both economies have suffered the most: in addition to direct tariff costs, they have to bear the indirect tariff burden of approximately 10 billion USD and 6.5 billion USD, respectively. Other major economies, such as the EU, Canada, and Mexico, incurred indirect tariff costs of around 700 million UDS to 1.7 billion USD (Figure 3). Additionally, the burden on third-party countries is expected to rise by 30% to 70% if we consider the hypothesis of complete tariff pass-through.
Figure 3: Indirect tariff burden caused by the US-China trade war in selected countries (million USD)
Conclusion and outlook
Our findings suggest that the US-China trade war does not only affect both countries. It also significantly increases the tariff burden faced by their major trading partners. Therefore, countries must work together to resolve trade disputes and -in doing so- uphold the overall stability of the global free trade system and the global economy. From a policy perspective, one way of achieving global economic stability may be to support wider regional trade agreements, such as the Regional Comprehensive Economic Partnership (RCEP) and the Trans-Pacific Partnership (TPP) agreement, which would help to strengthen relationships around a series of common economic and political objectives.
Finally, we would like to emphasize that the analysis of this study only considers the tariff cost effect of the US-China trade war; with the conclusions drawn being somewhat one-sided. However, considering that the COVID-19 epidemic has dramatically pushed up existing trade costs (WTO, 2020), the analysis conducted in this study holds particular relevance from a trade policy perspective as countries seek to navigate the challenging waters of the post-COVID-19 era.
Finally, we would like to emphasize that the analysis of this study only considers the tariff cost effect of the US-China trade war; with the conclusions drawn being somewhat one-sided. However, considering that the COVID-19 epidemic has dramatically pushed up existing trade costs (WTO, 2020), the analysis conducted in this study holds particular relevance from a trade policy perspective as countries seek to navigate the challenging waters of the post-COVID-19 era.
Endnotes
[1] See: http://www.igmchicago.org/surveys/trade-disruptions/
References
Baldwin, R., and Venables, A. J., 2010. Spiders and Snakes: Offshoring and Agglomeration in the Global Economy. Journal of International Economics, 90(2): 245–254.
Balistreri, E., Böhringer, C. and Rutherford, T. F., 2018. Quantifying Disruptive Trade Policies, CESifo Working Paper 7382.
Bown, C. P., 2021. US-China Trade War Tariffs: An Up-to-Date Chart. PIIE Chart, Peterson Institute for International Economics.
Diakantoni, Antonia and Escaith, Hubert and Roberts, Michael and Verbeet, Thomas, Accumulating Trade Costs and Competitiveness in Global Value Chains (January 23, 2017). WTO Working Paper ERSD-2017-02, Available at SSRN: https://ssrn.com/abstract=2906866 or http://dx.doi.org/10.2139/ssrn.2906866
Ferrantino, M. J., 2012. Using Supply Chain Analysis to Examine the Costs of Non-Tariff Measures (NTMs) and the Benefits of Trade Facilitation, U.S. International Trade Commission working paper.
Ma, A.C., and Van Assche, A., 2010. The Role of Trade Costs in Global Production Networks: Evidence from China’s Processing Trade Regime. World Bank Working Paper, World Bank.
Mao, H., and Görg, H., 2020. Friends Like This: The Impact of the Us-China Trade War on Global Value Chains. World Economy, 43(7), 1776-91.
Muradov, K., 2017. Trade Costs and Borders in Global Value Chains. Review of World Economics, 153: 487–509.
Rouzet D. and Miroudot, S., 2013. The Cumulative Impact of Trade Barriers along the Value Chain: An Empirical Assessment Using the OECD Inter-Country Input-Output Model. OECD working paper, OECD.
South China Morning Post (SCMP), 2020. What is the US-China trade war? Retrieved online from: https://www.scmp.com/economy/china-economy/article/3078745/what-us-china-trade-war-how-it-started-and-what-inside-phase
United States Census Bureau (USCB), 2022. Trade in Goods with China. Retrieved online from: https://www.census.gov/foreign-trade/balance/c5700.html
World Trade Organization (WTO), 2020. Trade Costs in the Time of Global Pandemic. Retrieved online from:
https://www.wto.org/english/tratop_e/covid19_e/trade_costs_report_e.pdf
Wu, J., Wood, J., Oh, K., and Jang H., 2021. Evaluating the Cumulative Impact of the US-China Trade War along Global Value Chains, The World Economy, 44(12), 3516-3533.
Yi, K. M., 2003. Can Vertical Specialization Explain the Growth of World Trade? Journal of Political Economy, 111(1), 52–102.
Yi, K. M., 2010. Can Multistage Production Explain the Home Bias in Trade? American Economic Review, 100(1), 364–393.